Agent Reliability Score
The Agent Reliability Score (ARS) is a composite metric framework that quantifies your agent’s overall reliability after each evaluation run. Rather than relying solely on rubric-based accuracy, ARS evaluates agents across multiple dimensions — correctness, consistency, operational efficiency, and more — producing a single 0–100 score alongside a detailed per-metric breakdown.
ARS is designed to be extensible. As Credal supports new agent architectures and capabilities, additional scoring dimensions can be added to the framework. The first version focuses on document-based and RAG agents — the most common pattern on the platform today.
ARS for RAG Agents
The initial ARS implementation targets agents that answer questions using retrieved documents (semantic search, pinned sources, collections). It evaluates six dimensions that capture the most important quality signals for RAG workflows:
The composite score is a weighted average of available components. Weights automatically re-normalize when a metric has no data — for example, consistency is excluded for single-trial runs, and trajectory efficiency is excluded for agents without tool use.
Source Fidelity
Source fidelity is the RAG-specific metric in ARS. It compares what the agent cited in its response against what the retrieval pipeline actually retrieved from the knowledge base, combining two sub-measures:
- Precision (60% weight): Of the sources the agent cited, how many were actually in the retrieved context? High precision means the agent isn’t fabricating or hallucinating citations.
- Coverage (40% weight): Of the documents that RAG retrieved, how many did the agent cite? High coverage means the agent is making use of available context rather than ignoring relevant documents.
Special cases: if no documents were retrieved and the agent cited nothing, a neutral score is assigned. If the agent cited sources but nothing was retrieved, it receives a lower score (the citations may come from the model’s parametric knowledge rather than grounded retrieval).
Accuracy
The accuracy component uses your rubric to evaluate answer quality. For document-based agents, this is where you encode domain-specific expectations — for example, “must cite the policy handbook” or “answer should include specific figures from the financial report.” Accuracy is the average rubric score across all test case items and all trials.
Consistency
When running multi-trial evaluations (2+ trials per test case), consistency measures whether the agent gives the same quality of answers when asked the same question repeatedly. For RAG agents, inconsistency often indicates non-deterministic retrieval ranking, sensitivity to chunk ordering, or model temperature effects. Consistency is calculated using the coefficient of variation of rubric scores across trials for each test case, then averaged.
Cost Efficiency and Latency
These operational metrics track whether the agent stays within acceptable resource budgets. Scores degrade linearly as the measured value approaches the configured ceiling. They apply equally to RAG and non-RAG agents.
Trajectory Efficiency
For agents with tool/action capabilities, trajectory efficiency combines:
- Tool execution success rate — what fraction of tool calls succeeded
- Path efficiency — how many reasoning loops the agent used vs. the expected optimal count
If the agent doesn’t use tools, this metric is excluded and its weight is redistributed.
Multi-Trial Evaluations
You can configure an evaluation run to execute each test case multiple times (trials). This enables the consistency metric and provides a more statistically robust view of agent performance. Each trial runs independently, producing its own response, rubric score, and cost/latency data. All other ARS metrics are computed across the full set of items from all trials.
Per-Test-Case Breakdown
Beyond the aggregate ARS score, Credal provides a per-test-case breakdown for four metrics: accuracy, latency, cost, and source fidelity. Consistency and trajectory efficiency are excluded from the per-test-case view because they are inherently cross-trial or require async data lookups. This breakdown helps you identify which test cases are dragging down your overall score.
Interpreting Your ARS Score
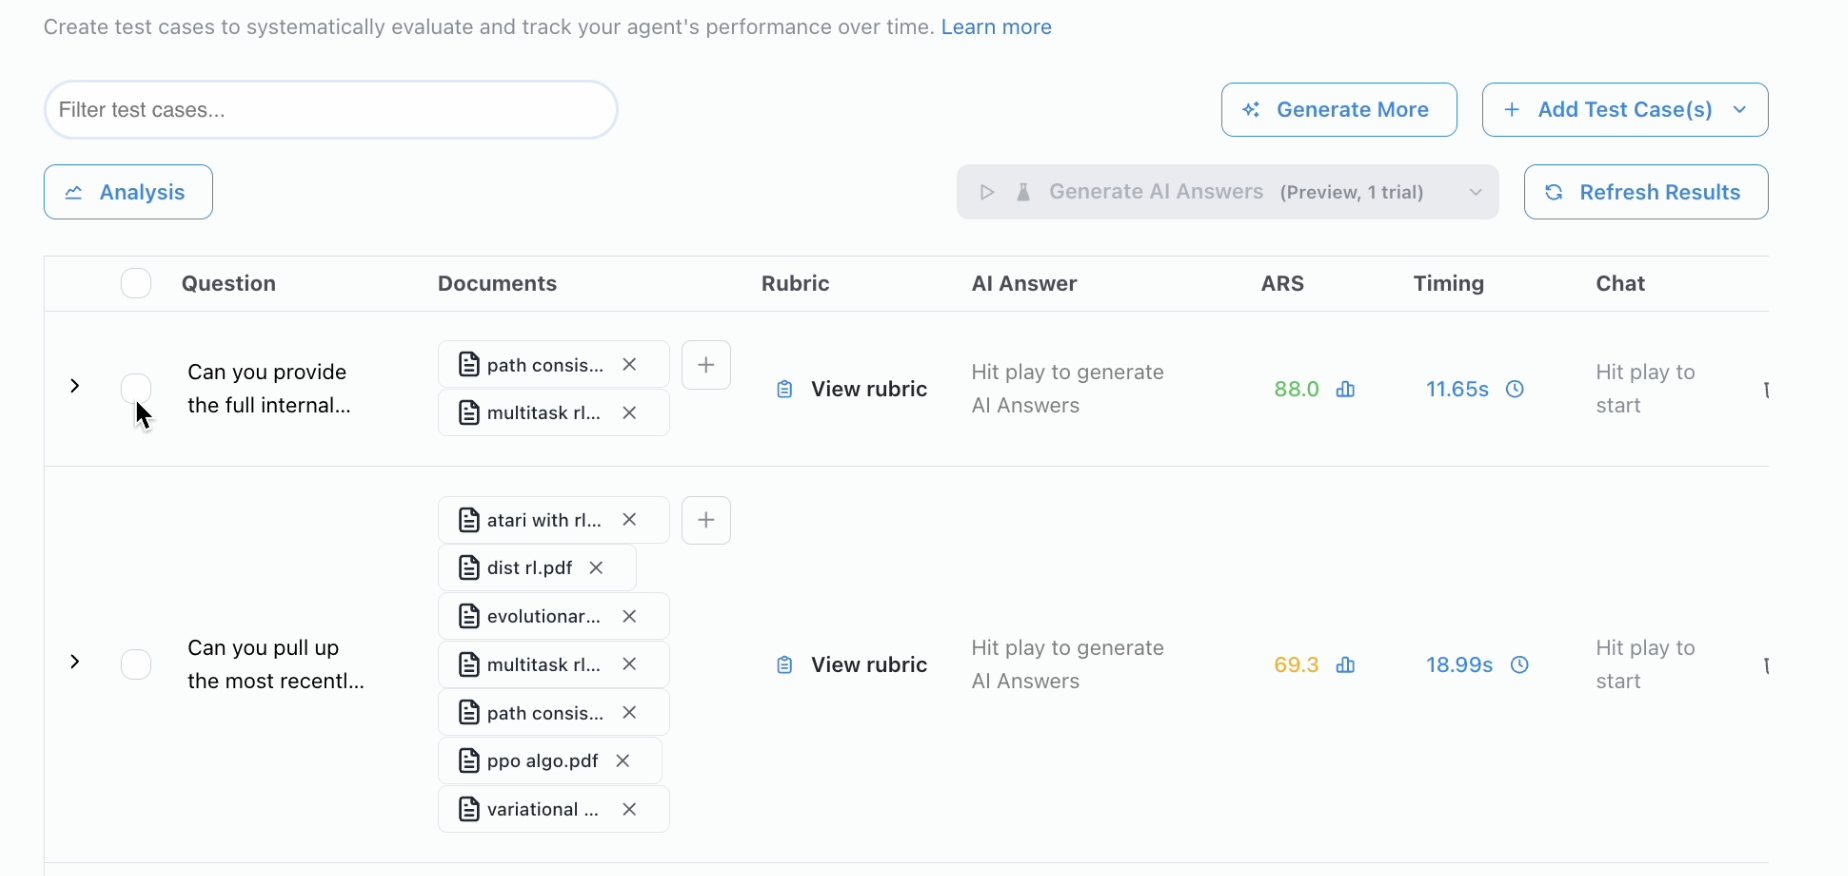
Viewing ARS Results
After an evaluation run completes, the ARS composite score appears in the Evaluate tab alongside test case results. Click on a run to open the Detailed Score Analysis, which shows the composite score, per-metric breakdown, historical rubric scores, and a score performance trend across past runs.
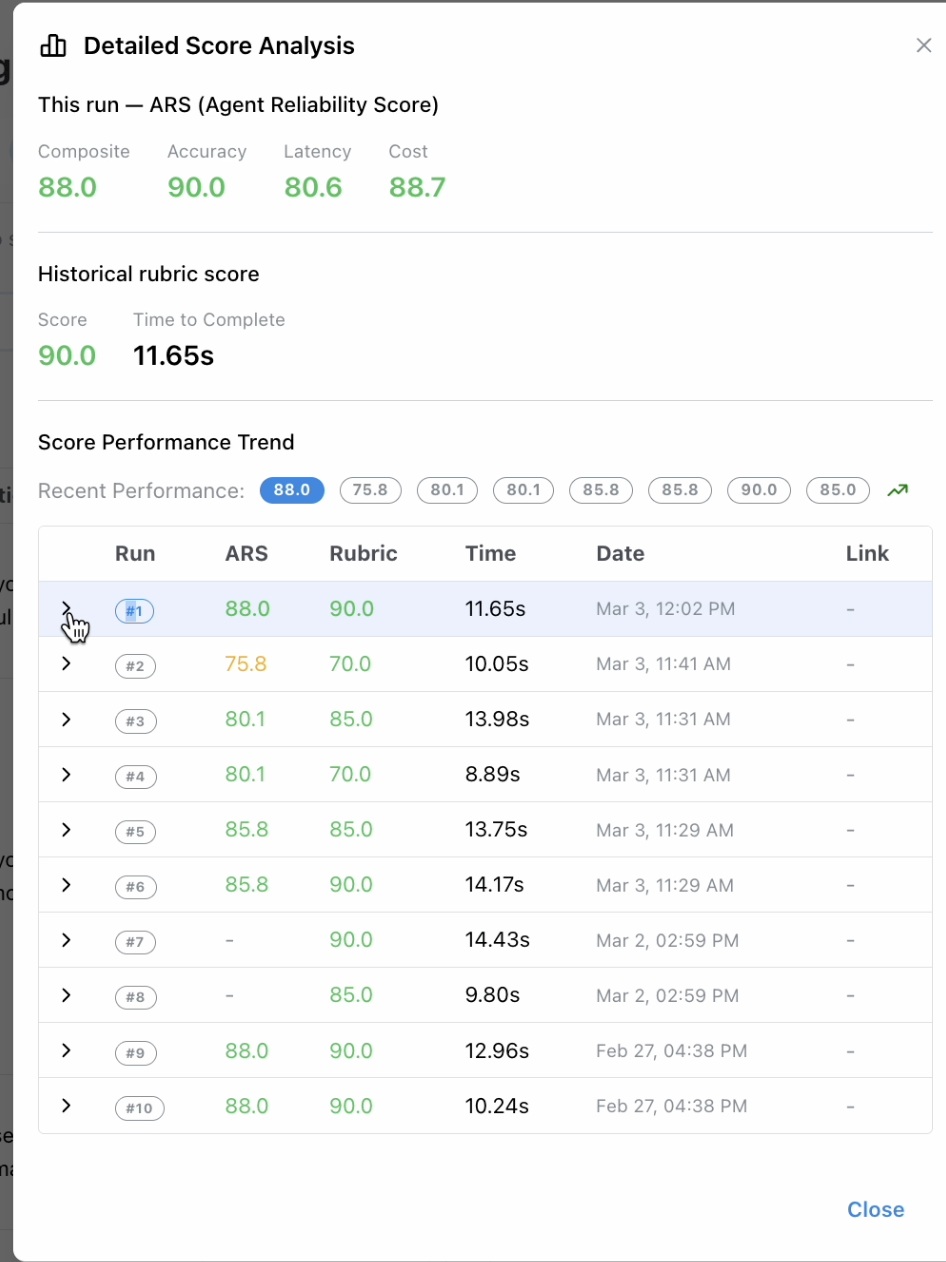
Historical ARS data lets you track how your agent’s reliability changes over time as you modify prompts, data sources, or configuration.